Sunday, April 8, 2012
Ocmulgee
The Ocmulgee Indian Mounds were really interesting to look at during last lab. There were areas where the soil profile was very easy to view and it seeing the different components was not too difficult. The wetland area was also very interesting. I never knew that companies/corporations were allow to purchase and build on wetland areas as long as they promised to buy and protect a larger area. It makes sense though because it is not really feasible to protect the whole area. I guess it is one of those situations where you make the best out of a potentially bad situation.


Thursday, March 29, 2012
Jackson Spring Park
Jackson Spring Park is absolutely gorgeous. Learning the history of the area was eye opening.


On a more geologic arena, we looked at rocks. The Gneiss rocks were interesting to look at because of the orderly structure.
We also took some of the soil and placed it into the tube that separates the larger and small pieces from each other. Each level of the tube further separates the material until you are left with the finest materials at the bottom. When we were at the community gardens, we sorted the soil by shaking the tube, but at the park, we sorted them out by placing water in the tube and slightly stirring it around.
Friday, March 23, 2012
Community Gardens
Community gardens provide fresh grown produce for the surrounding area. Raise beds are traditionally used because of the lead content in the soil from the houses that were once built in that area. The gardening was very different to me because I live in a rural area and not only is the gardening more extensive, but there is not a need for the raised bed...well, there may be a need but they are not used.

The Munsell Soil Chart is used to determine the color of the soil. Basically, one holds a same of the soil in his or her hand and uses the book to compare to see which one more closely resembles the soil.


The Munsell Soil Chart is used to determine the color of the soil. Basically, one holds a same of the soil in his or her hand and uses the book to compare to see which one more closely resembles the soil.
At times, however, it can be difficult to identify soils based primarily on the way they look, especially because some of the colors are very similar in appearance. There is another method of identifying soils; this method used the texture of the soils. At the community garden, we used a soil texture flow chart, based off of the soil texture diagram, to identify soils. This method uses touch as the primary method of identification.
Saturday, March 10, 2012
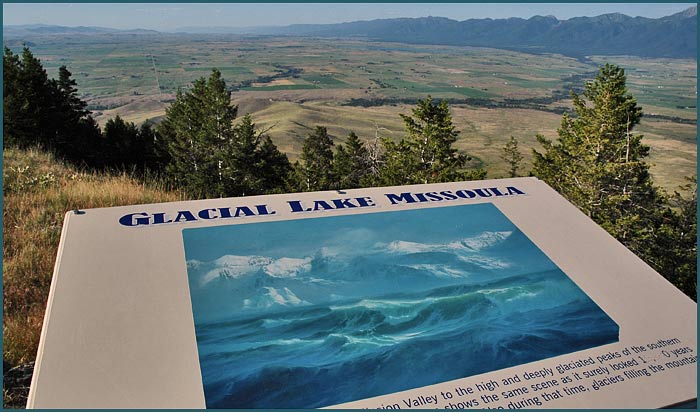
Glacial Lake Missoula
While all three of the videos we have watched during recent labs have been interesting, I was most intrigued by the scablands. I was most amazed by the fact that one man understood that the landscape had been shaped by a single cataclysmic event. He realized that his idea was radically different than the thoughts of his peers. The common geological belief at that time was that the land was shaped overtime by slow processes. His proposition was considered radical and foolish by many of his peers. While one of his peers was aware that a flood had probably occurred at that time with enough strength to produce the effects that he suggested, that man did not share his information for fear of professional suicide. Eventually his work was vindicated when the man was able to share his information.
Thursday, February 16, 2012
Igneous Rock: Rhyolite
Rhyolite is typically found in volcanic arcs. It is over 68% silicon dioxide. This high silica concentrate is responsible for the viscosity of the Rhyolite. Grain size is typically fine to very fine. The high silica content of rhyolite creates a high viscosity lava. Eruptions of rhyolite can be highly explosive due to the spontaneous release of large amounts of trapped gases.

Monday, February 6, 2012
Mineral Mania!
Hornblende:

Feldspar:

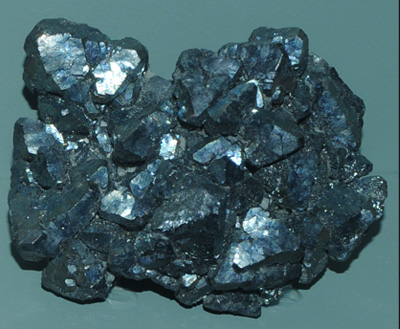
Galena:
Quartz:

Muscovite Mica:

Biotite Mica:

Calcite:

Halite:

Kaolinite:

Pyrite:

Obsidian:
 Amethyst:

Feldspar:
Galena:
Quartz:
Muscovite Mica:
Biotite Mica:
Calcite:
Kaolinite:
Pyrite:
Obsidian:
Tuesday, January 31, 2012
Cartography


Dot Density maps represent trends by using dots. Each dot represents a set number of occurrences. It allows the viewer to look and immediately compare separate areas to each other. This takes away some of the work on the part of the view. Above is an example.

A choropleth map is one in which areas are shaded in according to the particular measures of the data. This allows for an easy compare and contrast of various areas. It helps people visualize how measurements vary with in a defined area. Above is an example of a choropleth map that depicts the one-year forecast change in jobs.

A proportional map depicts numerical information in proportion to a circle scale. The map above depicts that the Mexican population decreases as one travels northward, with states along the boarder having larger percentages.

Isarithmic map example!
Link to a really cool video showing the Isarithmic History of the two party voting in the United States!
Subscribe to:
Posts (Atom)